Evaluation & Analysis
Table of contents
Analysis and Visualization
The above scripts will result in logs, prediction results, and retrieved data (if any). The paths of the saved files can be found in the script, and you can customize the paths if you’d like.
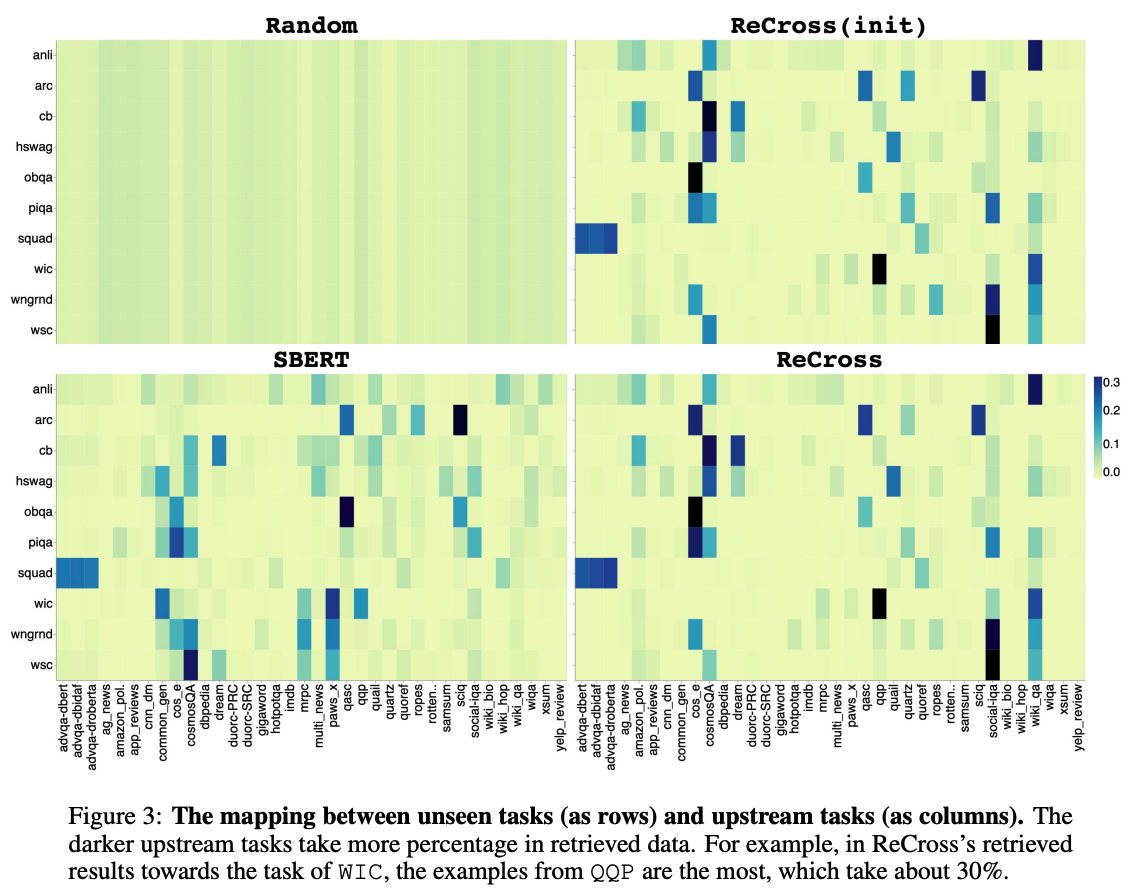
To analyze the performance and the behavior of the results on multiple task, please refer to the scripts/visualize_scores.py. We also use scripts/task_corr.ipynb to draw heatmaps for understanding the task correlation.
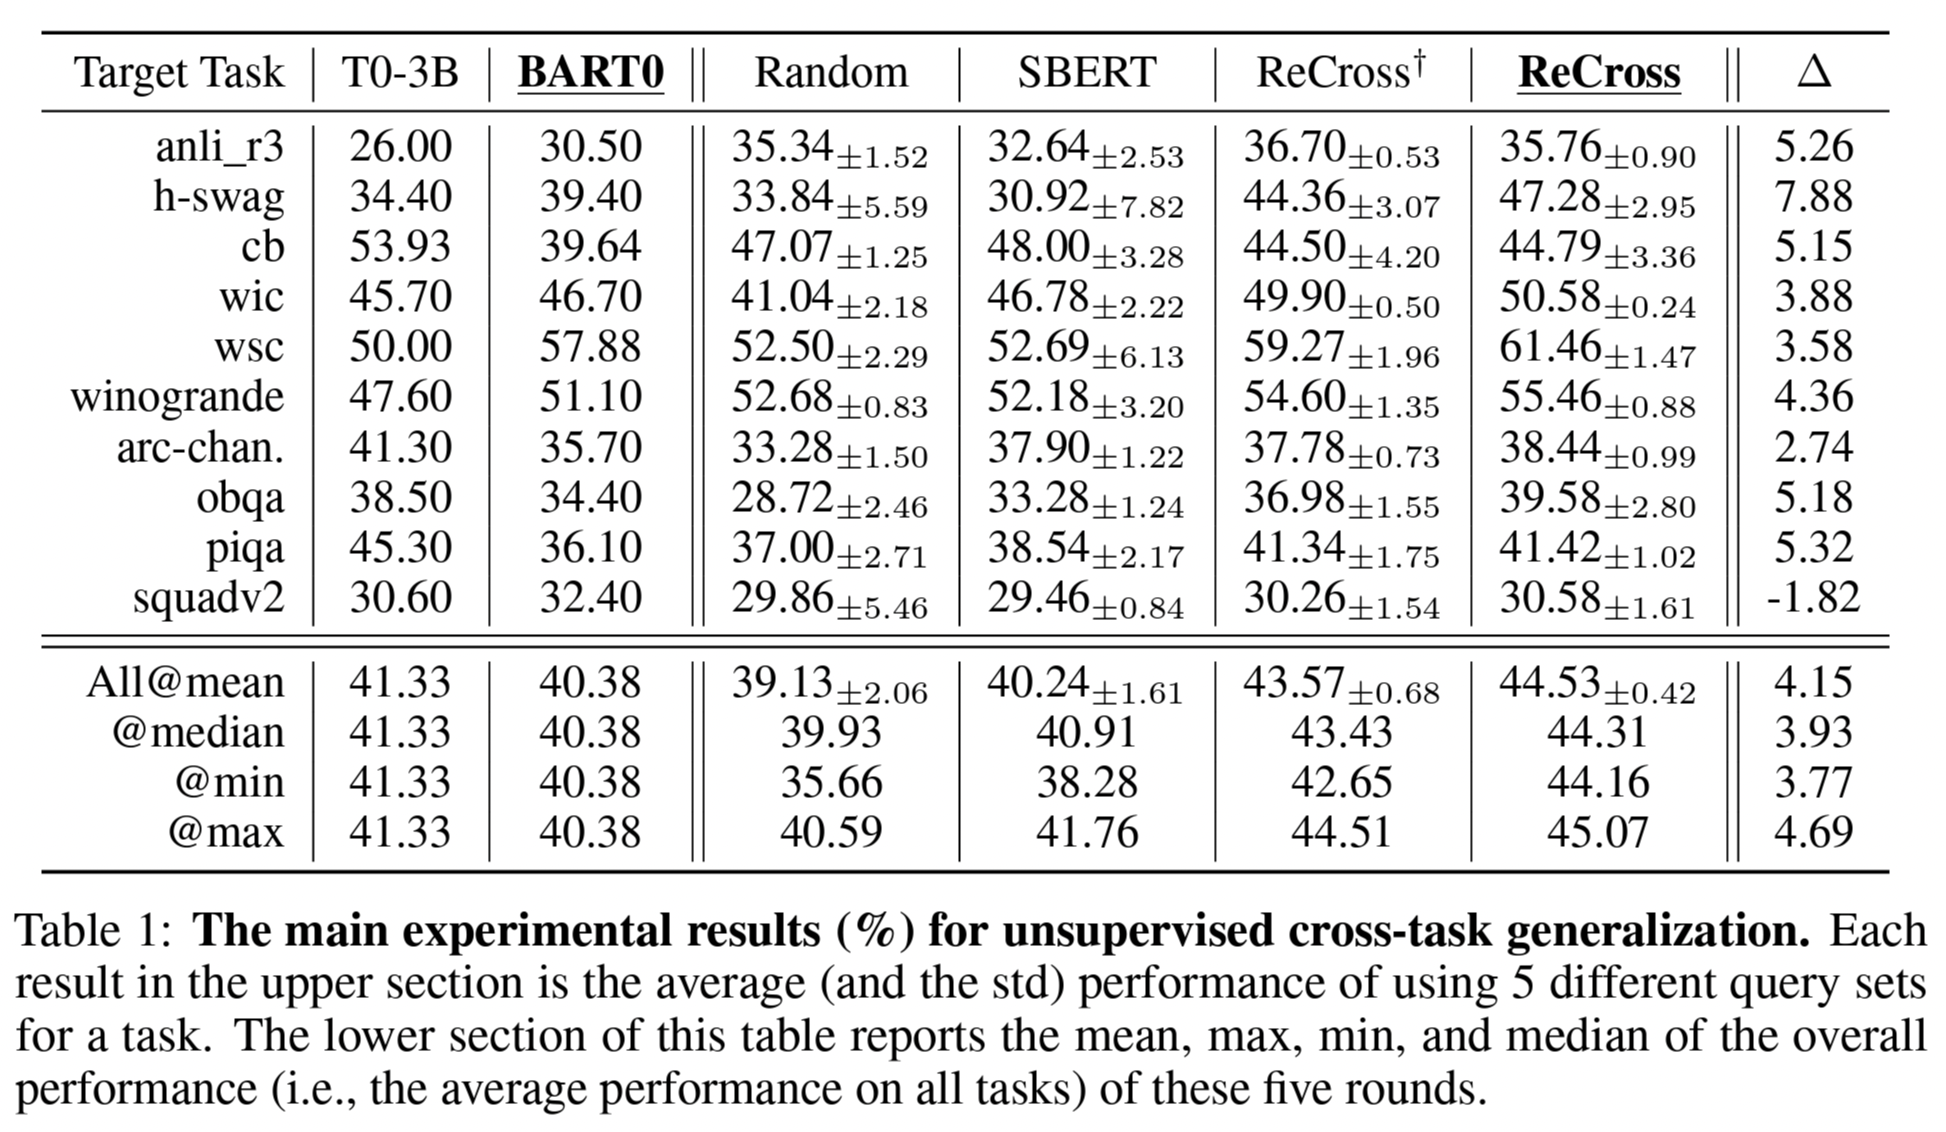
Main Experimental Results
Analysis on Task Correlation