Learning from Explanations with Neural Execution Tree
2 University of Southern California
3 Snap Research
Abstract
While deep neural networks have achieved impressive performance on a range of NLP tasks, these data-hungry models heavily rely on labeled data. To make the most of each example, previous work has introduced natural language (NL) explanations to serve as supplements to mere labels. Such NL explanations can provide sufficient domain knowledge for generating more labeled data over new instances, while the annotation time only doubles. However, directly applying the NL explanations for augmenting model learning encounters two challenges. First, NL explanations are unstructured and inherently compositional, which asks for a modularized model to represent their semantics. Second, NL explanations often have large numbers of linguistic variants, resulting in low recall and limited generalization ability when applied to unlabeled data.
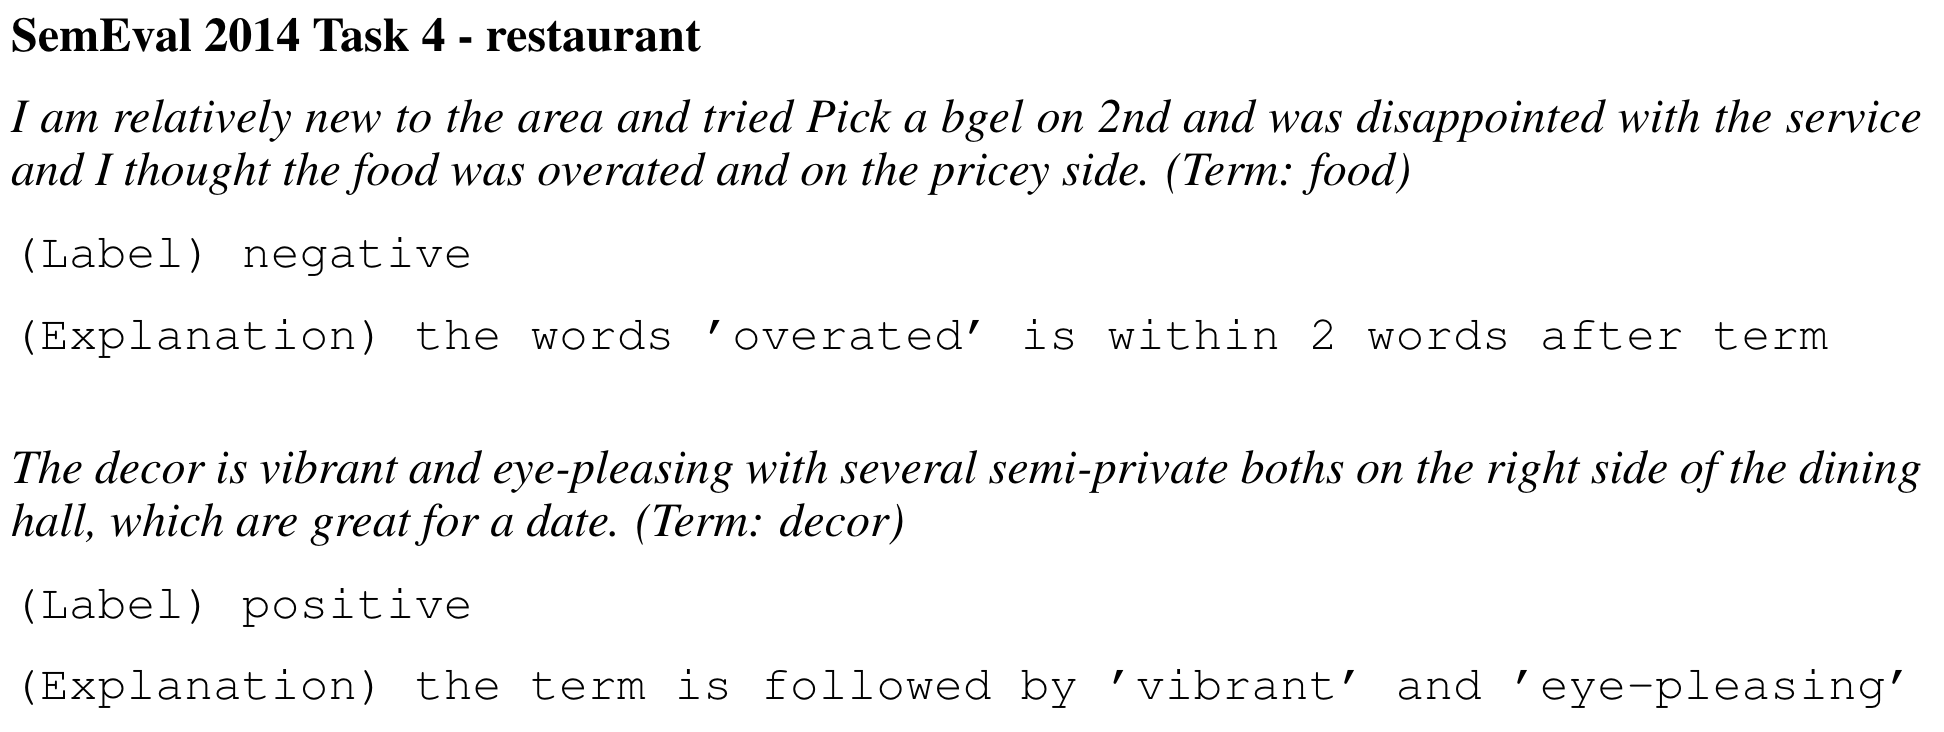
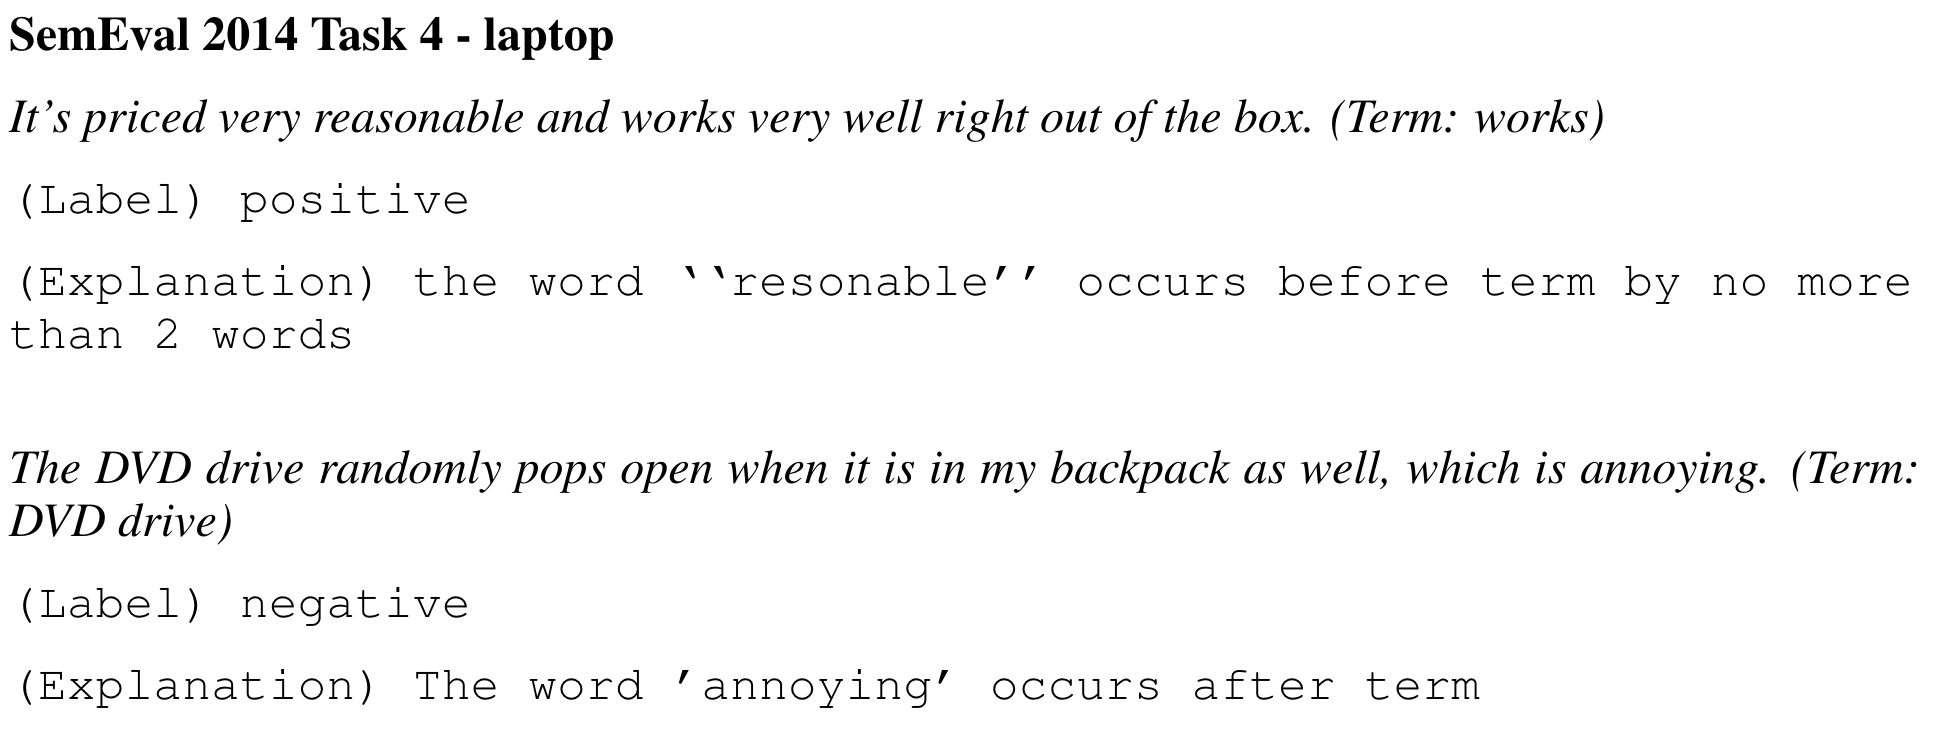
Some examples of labeling with explantions can be shown as following figure:
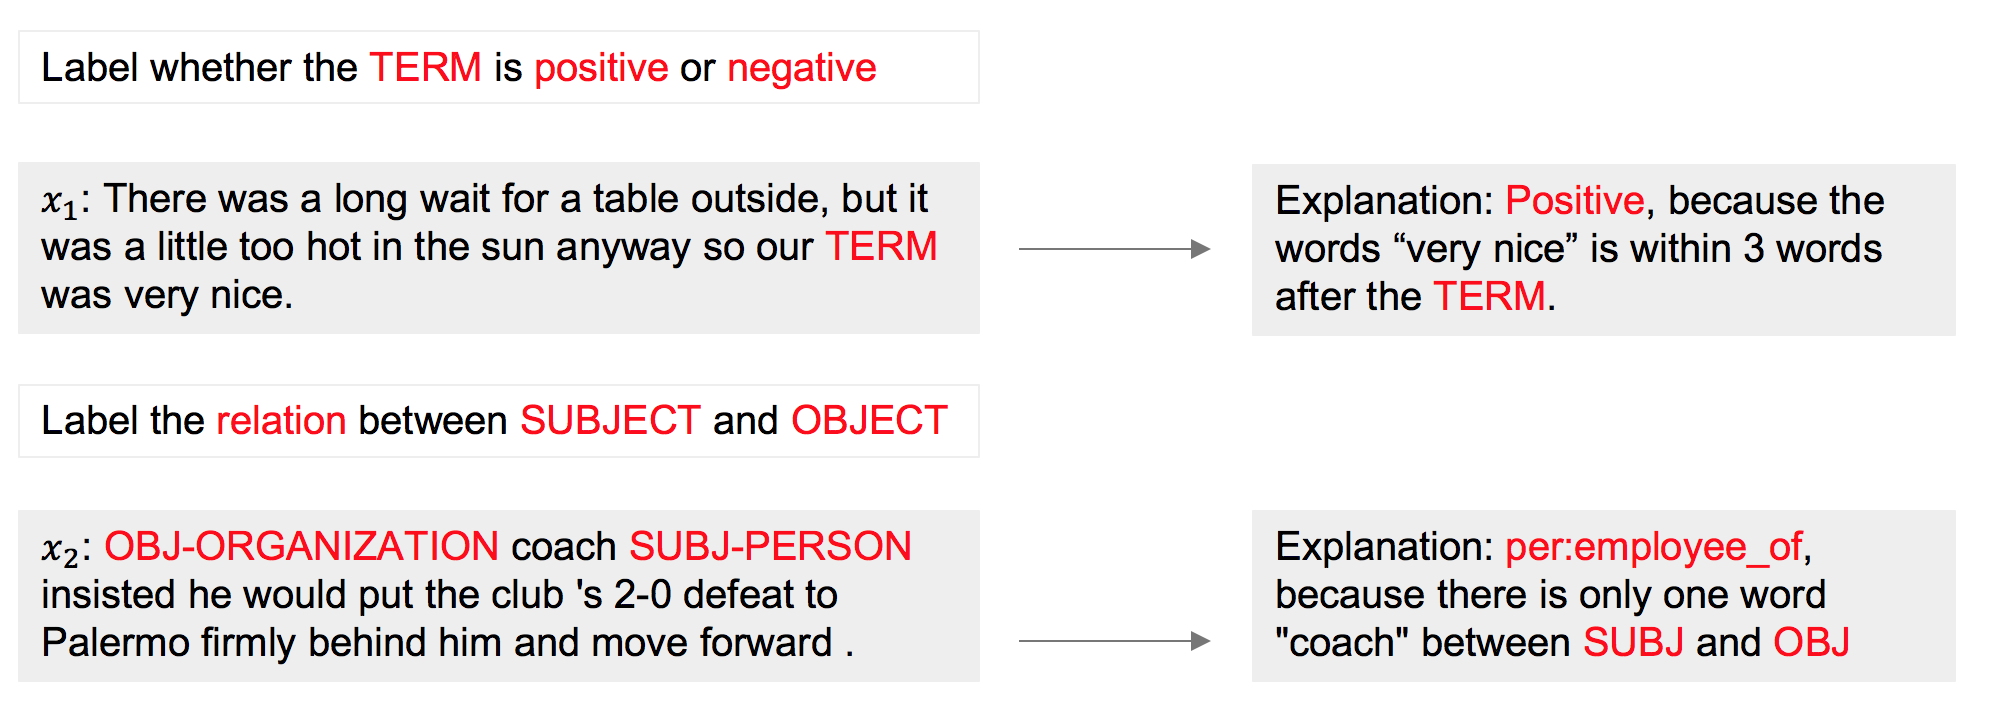
In this paper, we propose a novel Neural Execution Tree (NExT) framework for augmenting sequence classification with NL explanations. First, we transform NL explanations into executable logical forms using a semantic parser. NExT then employs a neural module network architecture to generalize the different types of actions (specified by the logical forms) for labeling data instances and accumulates the results with soft logic, which substantially increases the coverage of each NL explanation. Experiments on two NLP tasks, relation extraction, and sentiment analysis, demonstrate its superiority over baseline methods by leveraging NL explanation. Its extension to multi-hop question answering achieves performance gain with light annotation effort. Also, NExT achieves much better performance compared to traditional label-only supervised models in the same annotation time.
Datasets
We did our experiments mainly on two tasks: Relation Extraction(RE) and Sentiment Analysis(SA). For RE, we choose TACRED and SemEval2010 Task8 datasets. For SA, we choose SemEval2014 Task4 Restaurant and Laptop datasets.
We use Amazon Mechanical Turk to collect labels and explanations for a randomly sampled set of instances in each dataset. Turkers are prompted with a list of selected predicates and several examples of NL explanation.
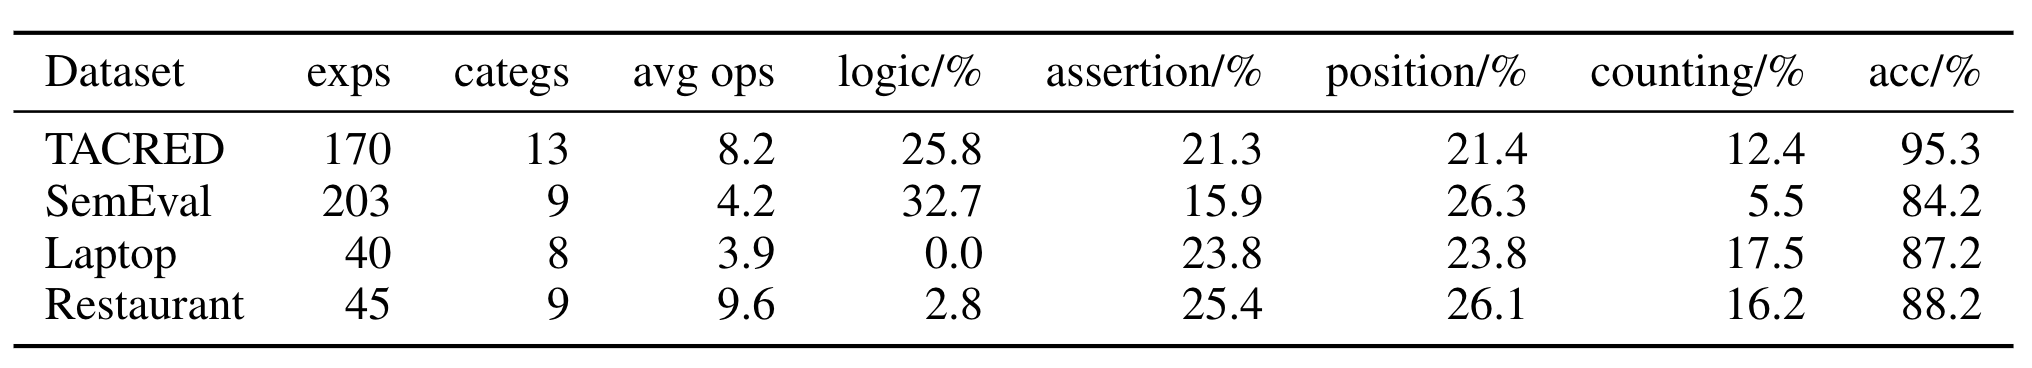
Statistics of curated explanations and intrinsic evaluation results of semantic parsing are summarized in a table . To ensure a low-resource setting, in each experiment we only use a random subset of collected explanations.
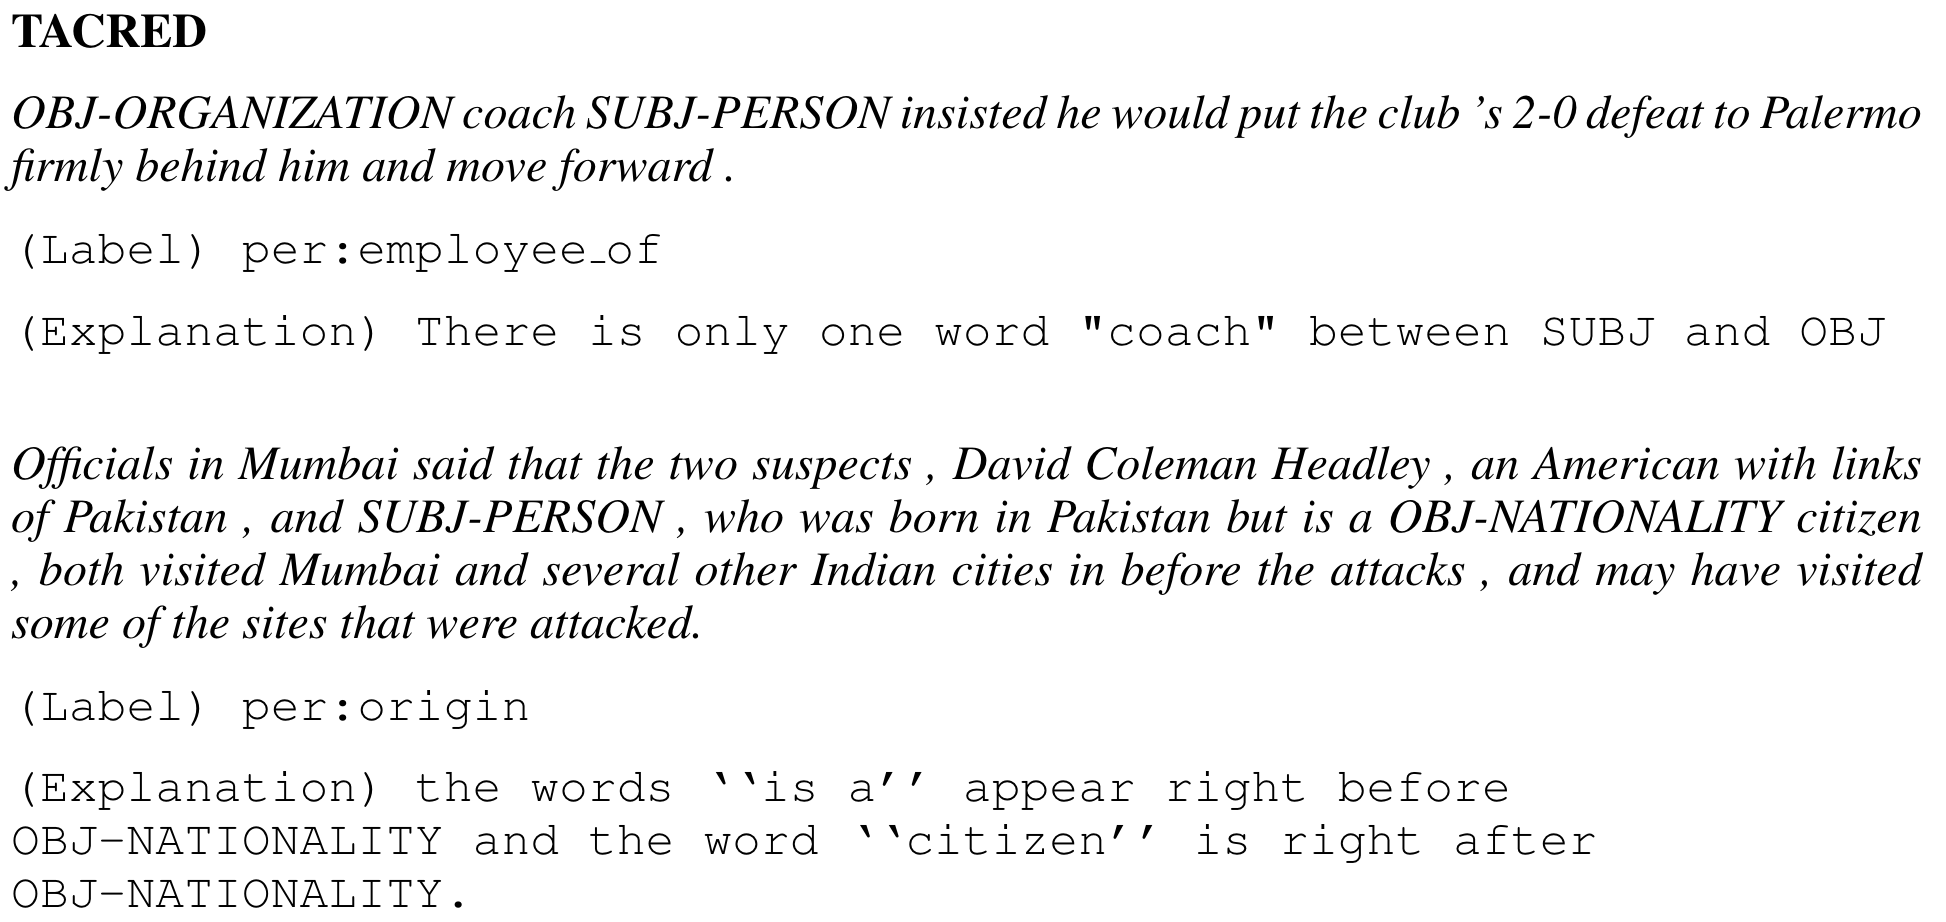
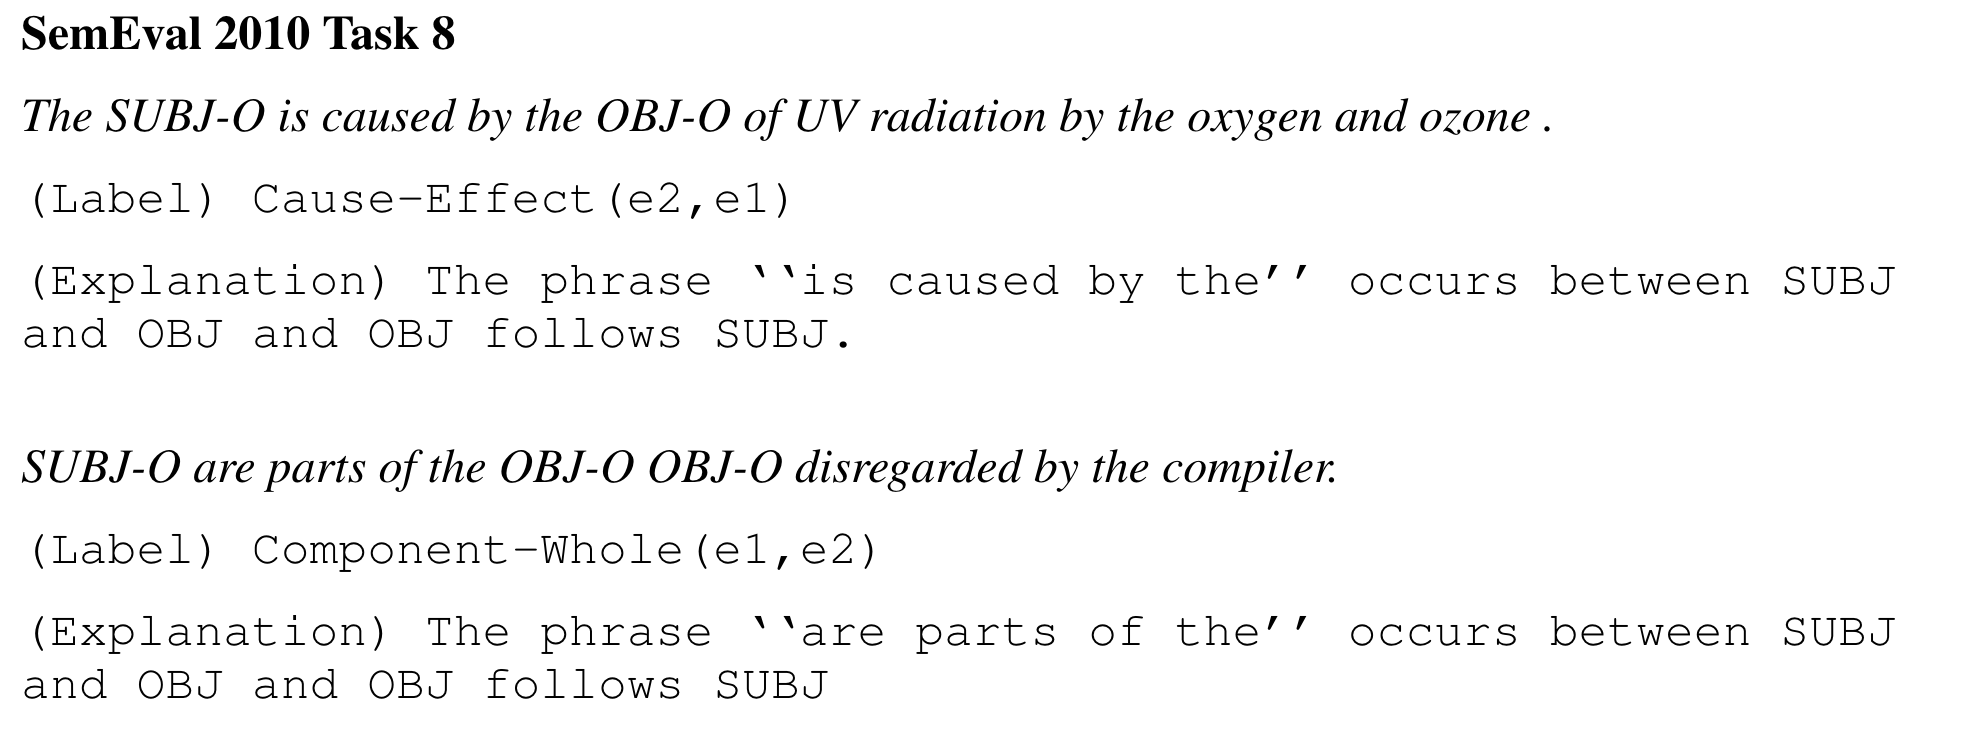
Click to see some examples of collected explanations.
Framework
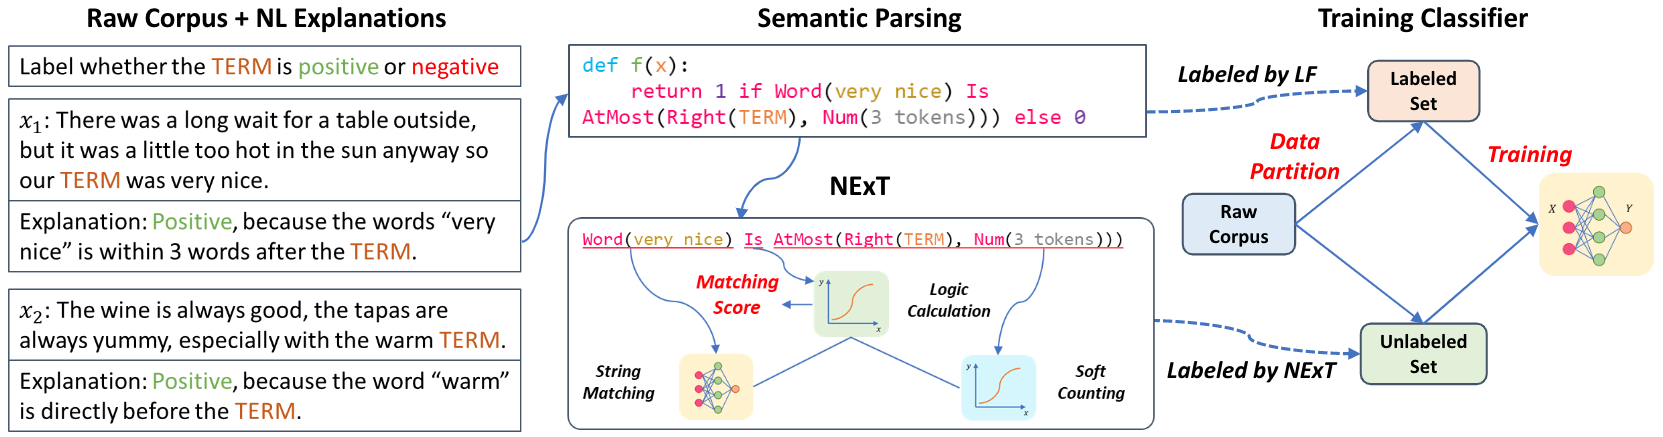
We proposed a framework to utilize NL explanations. Natural language explanations are firstly parsed into logical forms. Then we partition the raw corpus into labeled dataset and unlabeled dataset . We use NExT to provide supervision on . Finally, supervision from both and is fed into a classifier.
Model
We use NExT model to provide supervision on . To put it simply, this process could be summarized as following steps:
0. Transform human explanations to logic forms by a semantic parser.
1. Each logic form is decomposed as different combinations of several modules: String Matching Module, Soft Counting Module, Deterministic Function Module, and Logical Calculation Module.
2. NExT will define a different computation method of each module compared with original module.
3. NExT computes a score using new modules.
Following gif may help to understand:

Results
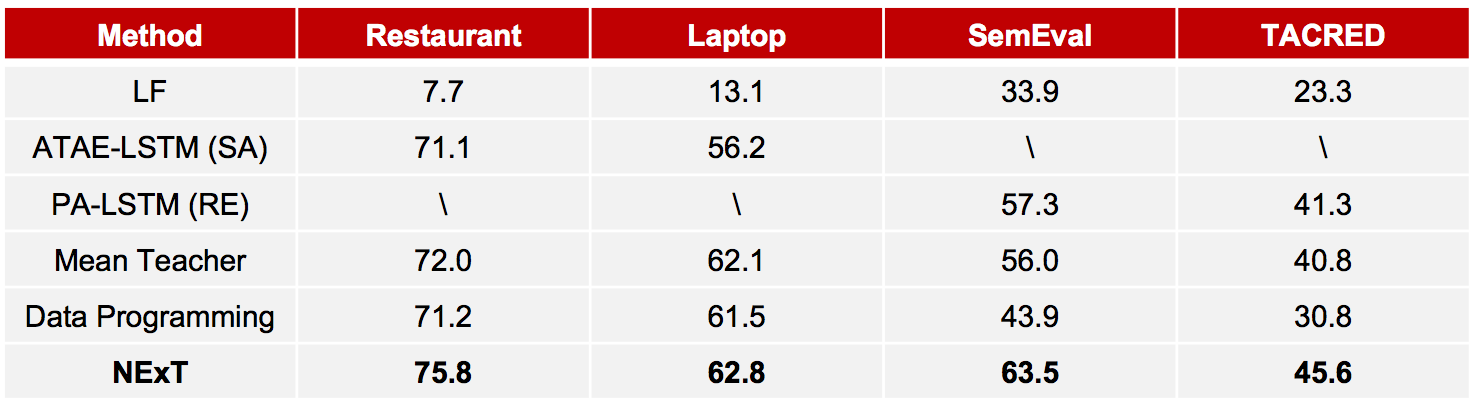
We compare our model with various baselines, and the results show that our model performs best.
In the real world, considering that labeling with explantions(denoted as strategy1) is more time consuming than traditional labeling(denoted as strategy2), we may want to know do our method still performs best within same labeling time. So we need to compare the results using labeling strategy1+NExT with results using labeling strategy2+basline models within same labeling time. we conduct experiments on TACRED and results are as follows:
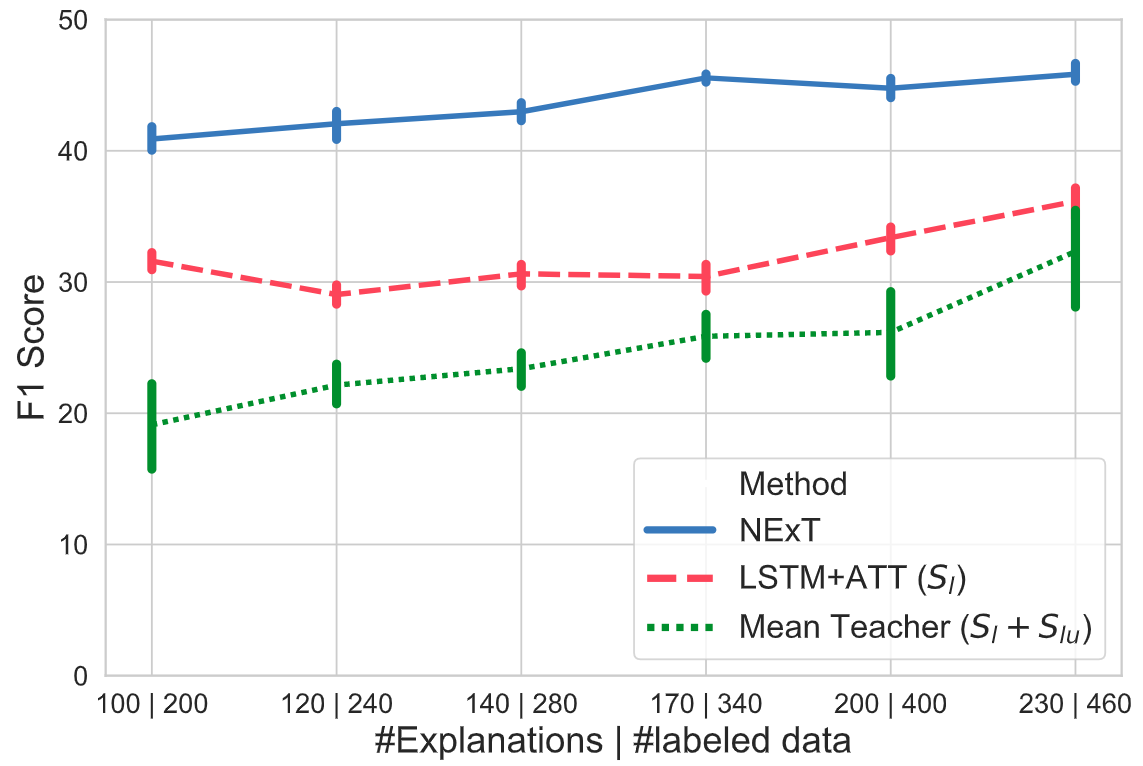
In this figure, x-axis means the number of labeling instance under labeling strategy2 | strategy1 with the same labeling time. Our own experiments find that labeling speed using strategy2 is twice of strategy1. y-axis means F1 score. Blue line is NExT model with labeling strategy1, while other lines are baseline models with labeling strategy2. Results show that our model still performs best in a real world setting.
For full results, please see our paper.
Cite
Please cite this paper if it helps you:
                @inproceedings{
                    qin2020learning,
                    title={Learning from Explanations with Neural Module Execution Tree},
                    author={Yujia Qin and Ziqi Wang and Wenxuan Zhou and Jun Yan and Qinyuan Ye and Xiang Ren and Leonardo Neves and Zhiyuan Liu},
                    booktitle={International Conference on Learning Representations},
                    year={2020},
                    url={https://openreview.net/forum?id=rJlUt0EYwS}
                    }